 The Office Concept
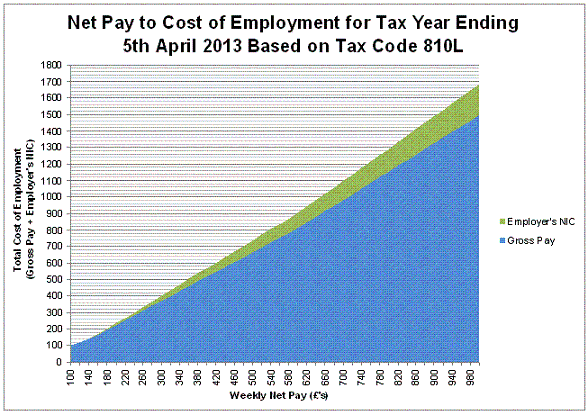
 | Weekly | Monthly | Annual | |||||||
|---|---|---|---|---|---|---|---|---|---|
| Net Pay | Gross Pay | Employer's NI | Total Cost | Net Pay | Gross Pay | Employer's NI | Total Cost | Salary | Total Cost |
100 |
100 |
0 |
100 |
433 |
433 |
0 |
433 |
5,200 |
5,200 |
110 |
110 |
0 |
110 |
477 |
477 |
0 |
477 |
5,720 |
5,720 |
120 |
120 |
0 |
120 |
520 |
520 |
0 |
520 |
6,240 |
6,240 |
130 |
130 |
0 |
130 |
563 |
563 |
0 |
563 |
6,760 |
6,760 |
140 |
140 |
0 |
140 |
607 |
607 |
0 |
607 |
7,280 |
7,280 |
150 |
151 |
1 |
151 |
650 |
652 |
4 |
656 |
7,828 |
7,875 |
160 |
163 |
3 |
166 |
693 |
709 |
12 |
721 |
8,502 |
8,642 |
170 |
178 |
5 |
183 |
737 |
773 |
21 |
794 |
9,272 |
9,519 |
180 |
193 |
7 |
199 |
780 |
835 |
29 |
864 |
10,025 |
10,373 |
190 |
208 |
9 |
216 |
823 |
900 |
38 |
938 |
10,794 |
11,250 |
200 |
222 |
11 |
233 |
867 |
964 |
47 |
1,011 |
11,564 |
12,127 |
220 |
252 |
15 |
266 |
953 |
1,091 |
64 |
1,155 |
13,086 |
13,858 |
240 |
281 |
19 |
300 |
1,040 |
1,219 |
82 |
1,301 |
14,626 |
15,612 |
250 |
296 |
21 |
317 |
1,083 |
1,282 |
91 |
1,373 |
15,378 |
16,466 |
260 |
311 |
23 |
334 |
1,127 |
1,346 |
100 |
1,446 |
16,148 |
17,343 |
280 |
340 |
27 |
367 |
1,213 |
1,473 |
117 |
1,590 |
17,671 |
19,074 |
300 |
369 |
31 |
401 |
1,300 |
1,601 |
135 |
1,736 |
19,210 |
20,828 |
320 |
399 |
35 |
434 |
1,387 |
1,728 |
152 |
1,880 |
20,732 |
22,559 |
340 |
428 |
39 |
468 |
1,473 |
1,856 |
170 |
2,026 |
22,272 |
24,313 |
350 |
443 |
41 |
484 |
1,517 |
1,919 |
179 |
2,098 |
23,025 |
25,167 |
360 |
458 |
43 |
501 |
1,560 |
1,983 |
188 |
2,171 |
23,794 |
26,044 |
380 |
487 |
47 |
535 |
1,647 |
2,111 |
205 |
2,316 |
25,333 |
27,799 |
400 |
516 |
51 |
568 |
1,733 |
2,238 |
223 |
2,461 |
26,856 |
29,529 |
425 |
553 |
57 |
610 |
1,842 |
2,398 |
245 |
2,643 |
28,772 |
31,710 |
450 |
590 |
61 |
651 |
1,950 |
2,556 |
266 |
2,822 |
30,671 |
33,868 |
475 |
627 |
67 |
693 |
2,058 |
2,716 |
289 |
3,005 |
32,586 |
36,049 |
500 |
663 |
72 |
735 |
2,167 |
2,875 |
311 |
3,186 |
34,502 |
38,230 |
525 |
700 |
77 |
777 |
2,275 |
3,035 |
333 |
3,368 |
36,418 |
40,411 |
550 |
737 |
82 |
819 |
2,383 |
3,194 |
355 |
3,549 |
38,333 |
42,593 |
575 |
774 |
87 |
861 |
2,492 |
3,353 |
376 |
3,729 |
40,232 |
44,750 |
600 |
811 |
92 |
903 |
2,600 |
3,512 |
399 |
3,911 |
42,148 |
46,931 |
625 |
852 |
98 |
950 |
2,708 |
3,694 |
423 |
4,117 |
44,326 |
49,407 |
650 |
895 |
104 |
999 |
2,817 |
3,880 |
449 |
4,329 |
46,565 |
51,954 |
675 |
939 |
110 |
1,048 |
2,925 |
4,067 |
475 |
4,542 |
48,804 |
54,502 |
700 |
982 |
116 |
1,098 |
3,033 |
4,255 |
501 |
4,756 |
51,065 |
57,079 |
800 |
1,154 |
139 |
1,294 |
3,467 |
5,002 |
604 |
5,606 |
60,022 |
67,270 |
900 |
1,326 |
163 |
1,490 |
3,900 |
5,748 |
707 |
6,455 |
68,978 |
77,460 |
1,000 |
1,499 |
187 |
1,686 |
4,333 |
6,496 |
810 |
7,306 |
77,956 |
87,680 |
 The Office Concept is a member of The Federation of Small Businesses.